Most of us have been there: you’ve written a fantastic application that performs perfectly in your Development and/or QA environments, but in Production something goes wrong. Your application spins out of control, utilizing 100% of your CPU. Maybe it simply stops responding as if it were deadlocked. Or maybe it simply crashes randomly. What now?
Logic tells you that you have a problem in the code somewhere that is only encountered in a Production-like environment… and if you could JUST get into the Production box, install Visual Studio (or at least the Remote Debugger), and debug the application, you’d be able to solve the problem. However, you can’t (because it’s Production!), and you can’t replicate the problem in any other environment. Maybe it’s because of stale Development or QA environment data compared to live Production data. Maybe it’s something else. You have no idea where to look to find and fix the problem in your application. For lack of eloquence: you’re screwed.
Fortunately, there are both tools designed for this very scenario and ways to “reproduce” the problem to determine the cause. I’m going to show you how to debug Production problems in applications where you cannot attach to the process for live debugging, and there are either no logs or the logs tell you nothing useful.
Let’s create a simple application that is designed to take up 100% of our CPU:
class Program
{
    static void Main(string[] args)
    {
        // Parallel to really max out the CPU
        Parallel.For(0, 100, (i) =>
        {
            while (true)
            {
                // Loop forever and ever
            }
        });
    }
}
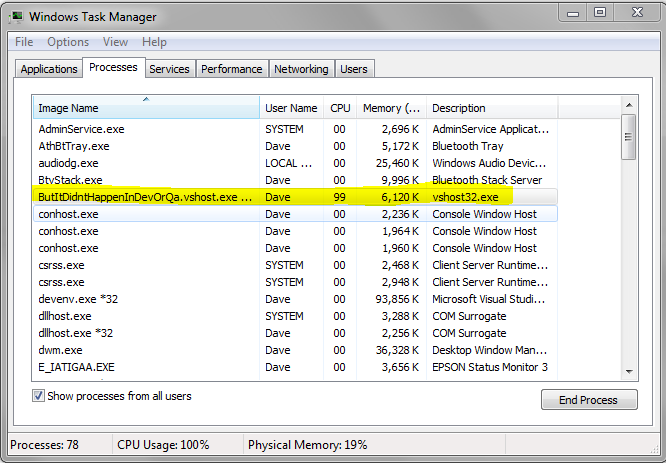
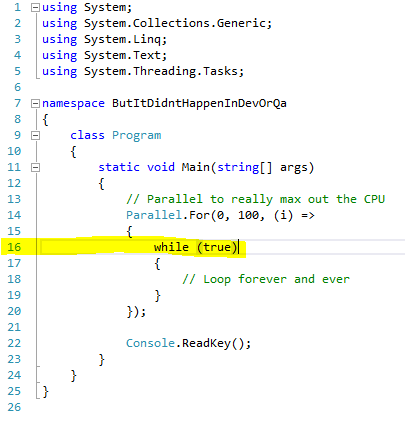
This code basically spawns 100 concurrent threads that loop for all of eternity. The reason that we do this using the TPL / Parallel library is that a single threaded application would only max out 1/N of our CPU, where N is the number of cores in the processor. Verifying our simple application, we can see that it does its job and maxes out our CPU:
Now, imagine that this application is a lot more complex and that this simple method is just one part of the entire solution. Perhaps you’ve built a really huge website or service and this method exists in just one little part of it. Pretend also that this method is not hit in your Development or QA environments during testing, and so your application appears to operate normally to you.
In fact, pretend that you’ve never seen this source code at all. All that you know is that you have an application in Production that spins out of control, and you don’t know where the problem is – or even where to begin looking.
So, what do you do?
The first thing we need to do is ensure that we have the tools we’ll need to debug and fix the issue. Things you’re going to need:
- A tool that can create Mini-Dumps. I highly recommend Process Explorer which is available via TechNet.
- WinDBG, via Debugging Tools for Windows, an unintuitive yet key tool from Microsoft for debugging Mini-Dump files. When you install this, you’ll have to do it through the Windows Software Development Kit installer. You can unselect everything except Debugging Tools for Windows, since you’ll need nothing else for our purposes.
Install WinDBG on the PC which you’ll use to analyze the Mini-Dump (typically your Development machine). Install Process Explorer on the Production box that hosts the application which is misbehaving.
Now that you’ve got those installed, we’ll proceed and figure out the problem.
So our scenario is this: we have an application running in Production which is spinning out of control, we have the source code on a different PC, and we can’t attach a debugger to the Production environment. We can’t reproduce this behaviour in Development or QA environments at all. So, time to get down to the details of the problem.
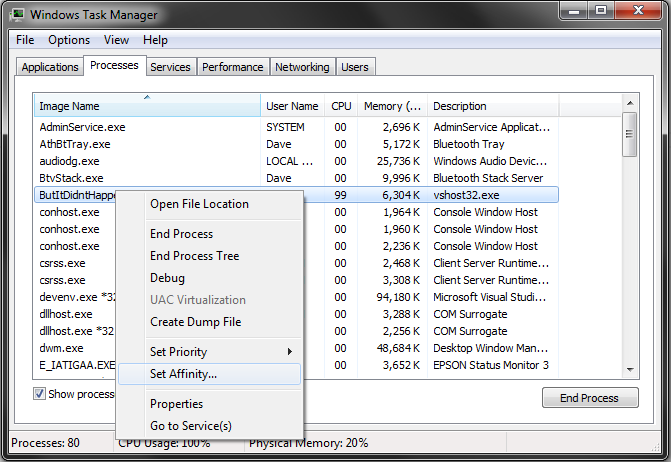
Step 1 is easy. You need to take a Mini-Dump of the misbehaving application on the Production machine. There’s a bit of a catch 22 here in that the rogue application is using 100% of your CPU, so this Mini-Dump could take forever. To solve that problem on a multi-core machine, simply use Task Manager to set the affinity of the misbehaving application to 1 or 2 cores to lower the total CPU used by the application, thus freeing up CPU for our Mini-Dump:
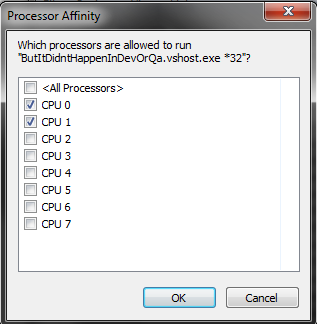
Unselect “All Processors” and pick 1 or 2:
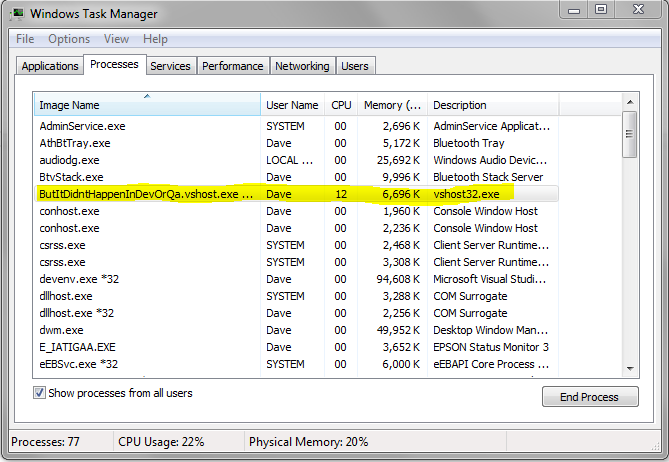
There, now it’s a lot easier to do things on the affected PC since it isn’t spending 100% of its CPU spinning on your application:
Note that the affinity setting does not persist, meaning the next time you launch the application, it will go back to using all CPUs per usual.
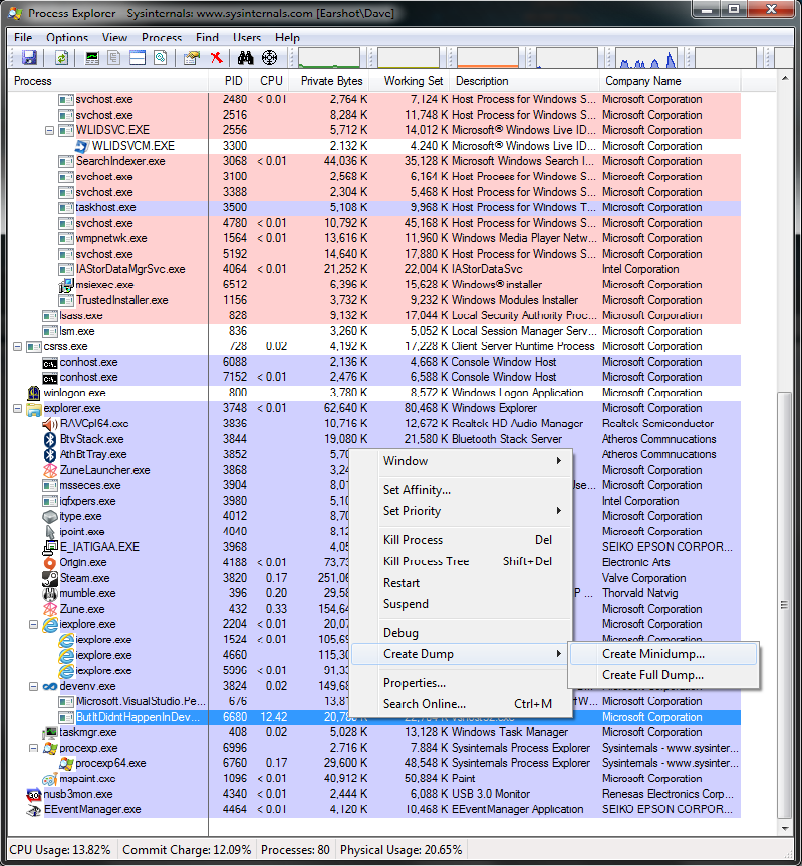
So, now we’re on to Step 2. Take a Mini-Dump (haha). To do this, launch Process Explorer, find your rogue application, right click, Create Dump –> Minidump:
Now save the .dmp file somewhere that your Development PC can get to it in order to debug the issue.
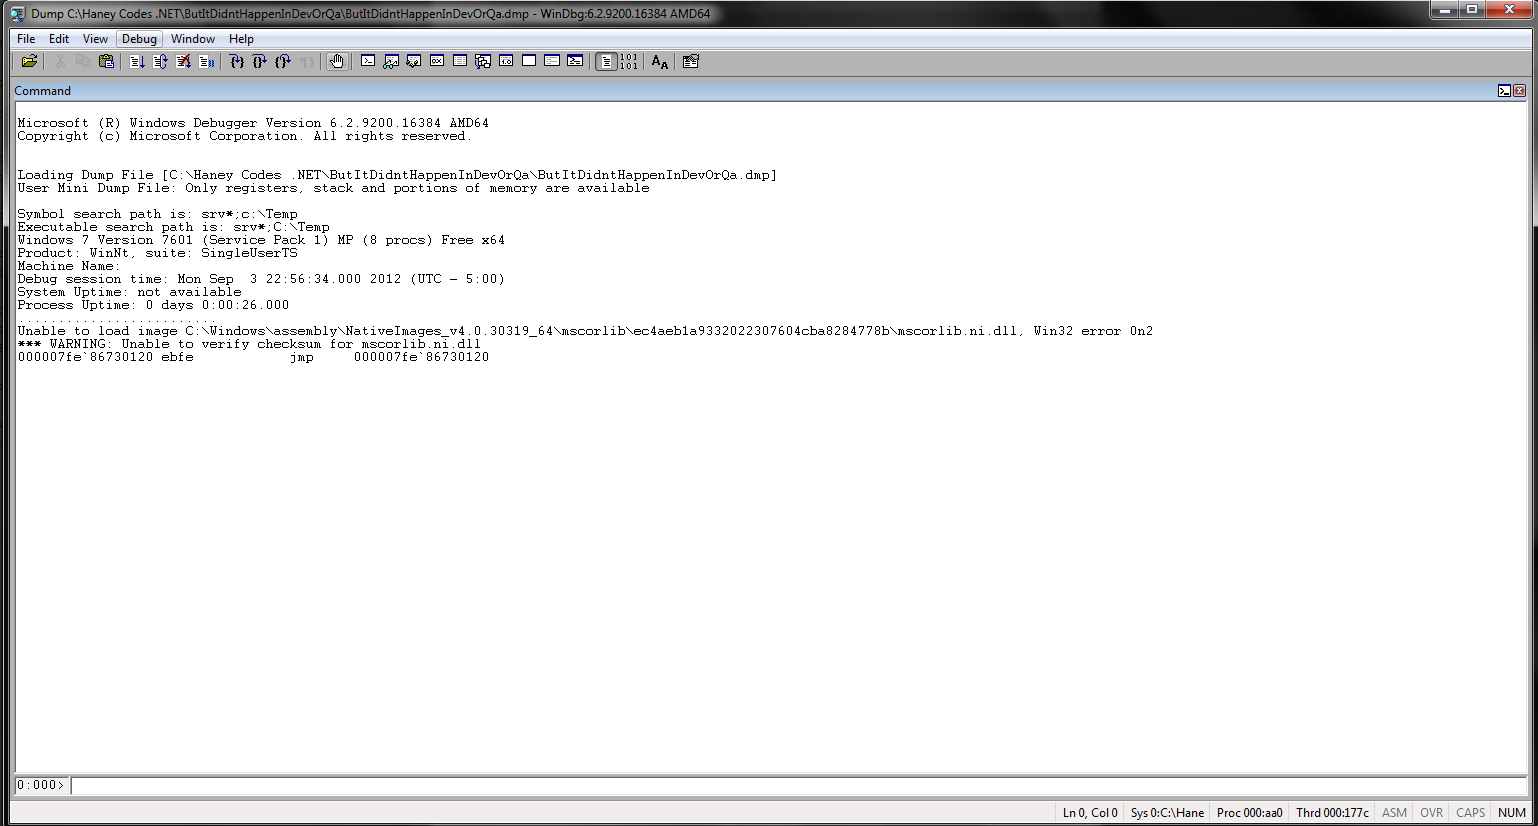
Step 3. Great, so now we have our .dmp Mini-Dump file… so let’s get cracking on debugging it. Get the .dmp file to your Development PC and fire up WinDBG. NOTE: run the 64 bit version for 64 bit applications and the 32 bit version for 32 bit applications. If you experience weird behaviour, try switching the WinDBG version that you launch. You’ll be greeted with a pretty bland grey window. Go to File –> Open Crash Dump (or CTRL + D for the shortcut fans out there). Select your .dmp file and you’ll end up with a screen similar to this:
So now the “hard” part begins. We need to manually diagnose the issue. The first step in WinDBG is usually to load up the CLR runtime so that we can examine our stack. To do this, run either:
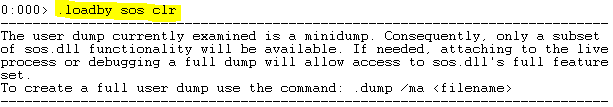
.loadby SOS clr // for .NET 4+
OR
.loadby SOS mscorwks // for .NET 3.5 or lower
My app is .NET 4, so I ran .loadby sos clr to load the CLR. This is what it should look like if it succeeds:
Next we need to load the symbols for the application that we’re debugging. To do this, run the following commands:
.symfix
.sympath+ **<absolute path to your application's compiled code and symbols>**
Here’s what I did for my Symbol Path for reference:

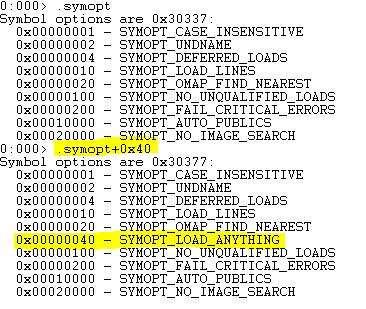
Next, run .symopt+0x40 to enable symbols to be used which are not perfectly matched. This setting is extremely useful in cases where the code is compiled locally and doesn’t perfectly match the production code that the Mini-Dump was taken from. If this setting is omitted, you will have a very bad time determining the issue, so make sure that you run it. This is what it looks like:
Now that you’ve specified the path at which to look for symbols for your application, run the reload command to reload your symbols:
.reload /v /f
You might get some warnings and errors here but that’s usually fine as long as they don’t relate to your application’s DLLs. Verify that it found your application’s symbols by reading the output of the .reload command:

Alright, almost there! Now we have our symbols and CLR loaded, so let’s find out what our application is spending all of its time doing. Run the command:
!runaway
And you’ll find out which threads have been using the most CPU time. Mine looks like this:
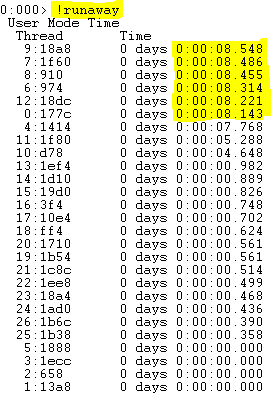
So here we can see that we have 6 threads which are taking up more time than all of the others… We need to print their stack traces and see just what is going on. Execute this (super intuitive) command to see the stack trace of the first thread:
~~[9:18a8]e!clrstack
Super intuitive right? Basically it says “gimme the CLR stack trace for the thread whose ID is in the square brackets”. Here’s what mine spits out:
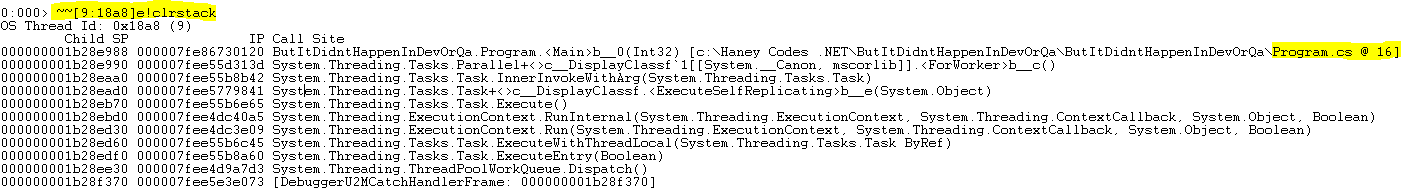
And now we know the culprit! So, we proceed to our source code and sure enough, line 16 is our problem:
And there you have it. How to debug production issues from your development environment.
Note that you can also determine what caused a crash using WinDBG… Have your system administrator enable Mini-Dumps for crashes, and then perform the same commands as we did in this post EXCEPT that at the part where we ran !runaway, instead run !analyze -v and !clrstack – these will get you on your way!