Sorry for the delay in posts, May has been a very busy month.
In order to accurately debug or profile an external assembly or library (AKA one you’re not directly compiling), you need the associated PDB files to accompany each of the DLLs. These files give the debugger some information about the compiled assembly so that your debugger or profiler can become aware of function names, line numbers, and other related meta data.
One thing that sucks is debugging and profiling native Microsoft .NET assemblies. When debugging an exception where you have no line number, or performance profiling an application and not knowing what method is being referred to, it’s easy to become very frustrated, very quickly. The latter scenario happened to me just this week. I was performance profiling my application at work and found that a large portion of the application’s time (~43%) was spent in a method called “clr.dll” (displayed here as memory addresses):
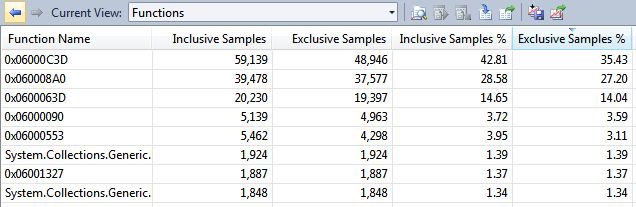
This was not exactly a useful indication of what REALLY happened. What am I supposed to do with the knowledge that over 40% of my application’s time is spent in a Microsoft assembly called “clr.dll”? Not much, which is a little concerning. I needed to know what was really happening!
Fortunately, there’s a solution for this very issue. A little known feature implemented in Visual Studio 2010 is the ability to connect to Microsoft’s Symbol Servers and obtain most of the debugging symbols for their assemblies and libraries!
Just go to: Tools –> Options –> (expand) Debugging –> Symbols
Here, select/check the “Microsoft Symbol Servers” as a source for Symbols. Now, getting the symbols from Microsoft every time you debug or profile is going to be slow and painful (and it’ll even give you a pop-up saying as much once you check the Microsoft Symbol Servers), so be sure that you specify a directory for the “Cache symbols in this directory” input – it will keep a local copy of the PDBs and simply check for updates every so often. As a result, you get your regular debugging/profiling AND you can see the function names of the Microsoft assemblies!
Using this feature, I was able to re-evaluate my latest performance tests and see that the supposed “clr.dll” method was actually “TransparentProxyStub_CrossContext” – a method buried deep within the WCF framework:

A little Google-Fu and a discussion with a co-worker who is well-versed in WCF told me that my application was actually spending its time waiting for a reply from a WCF request. Since this was expected behaviour (the application calls out to a service for every request), it put my performance profiling mind at ease.
Take advantage of Microsoft’s PDBs, especially when the price is right – free. You’d be amazed how useful they are in your day-to-day debugging and profiling.